
AUSTIN, Texas — Professor Lauren Ancel Meyers is the director of the COVID-19 Modeling Consortium at the University of Texas, which builds models projecting coronavirus spread in Austin, in Texas and across the U.S.
KVUE spoke with her about projections for Austin following the Thanksgiving holiday and how the team makes its projections.
How does the holiday play into future projections?
"There's a lot of uncertainty right now. Unfortunately, we went into the Thanksgiving holiday with COVID surging in a lot of cities across Texas, across the U.S. And so that means that people may have unknowingly showed up at their Thanksgiving gatherings infected. The problem with this virus is that it's a silent spreader. People could feel perfectly healthy but actually be carrying the virus and spread it to others. And we won't be able to tell, in our models and our projections and the estimates we make on a daily basis, whether Thanksgiving gatherings really did amplify the spread of the virus for another week or two. It takes a little while. Somebody became infected this past weekend. Usually, there is five or six days until they feel symptoms, if they ever feel symptoms at all. It may take them another day to go get tested, a couple of days to get the results. And so what happened over Thanksgiving weekend probably won't show up in the data for another week or two. And in particular, when we're tracking and projecting COVID in Texas, we are often looking directly at the hospitalization data rather than the case data. And if Thanksgiving did lead to the faster spread of the virus, we probably won't see that in the hospitalization data for at least two weeks. And so we're sort of waiting. We're holding our breath. We're hoping that people took sensible precautions, that they listen to the authorities and the doctors and the folks who are cautioning people to be careful, because this is a dangerous time for COVID. Hopefully, people took precautions, they kept their gathering sort of small, but we don't yet know what it's going to look like in the coming weeks."

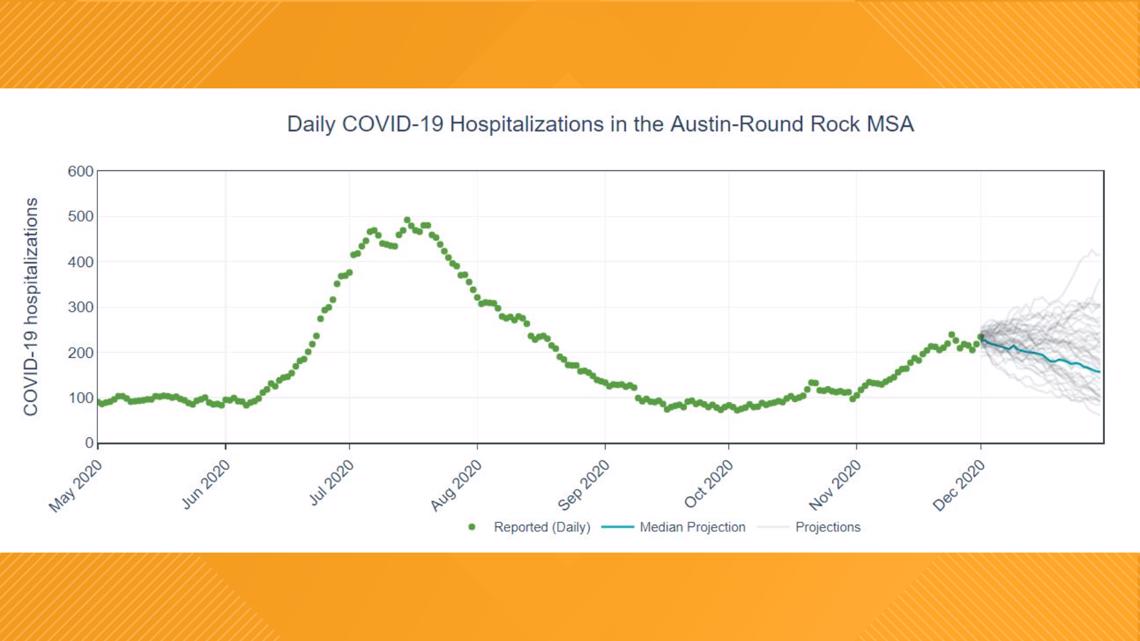
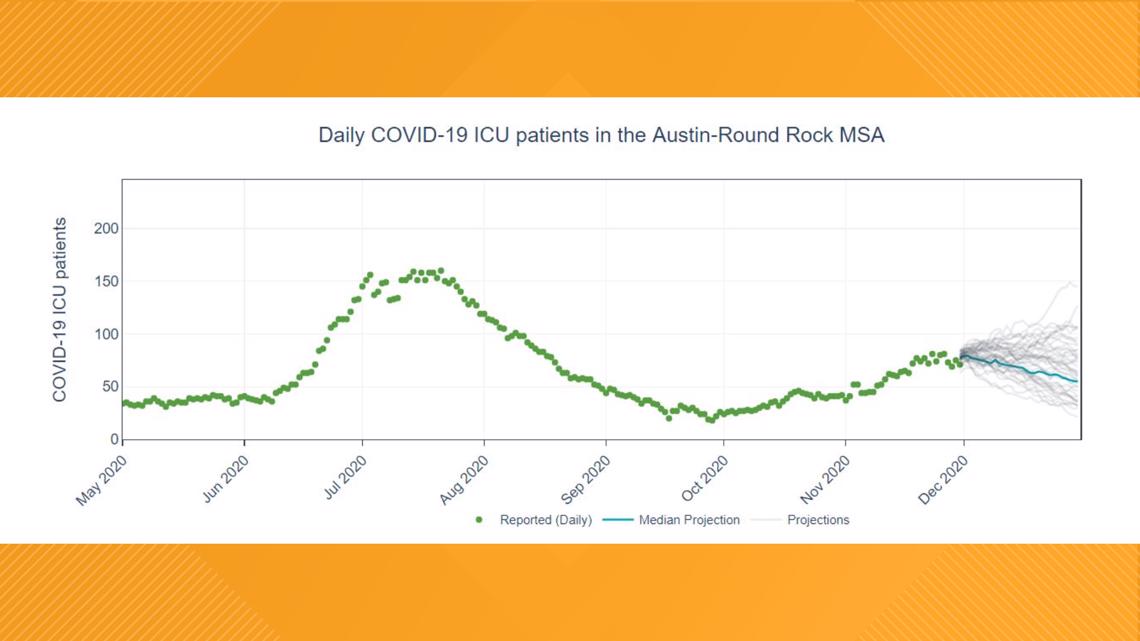
Projections now show the median declining, but show a lot of gray lines. Can you explain what those are?
"We don't have the perfect crystal ball. We can't tell you exactly how many hospitalizations are going to be next week or next month, but we can make some good estimates for what it might look like. And what those spaghetti lines are, it's very much like what you'd see in a weather forecast, they are equally plausible future trajectories of this pandemic. And if you look at our dashboard as of today for Austin and you look at, for example, our hospital admissions, you'll see this sort of dark blue line that gives what we call a median or a sort of a likely projection. But all of those gray lines are equally likely. So even though most of those gray lines are pointing in a sort of optimistic direction, they look like they're flat or going downhill, there is still a significant chance that we will continue to trend upwards. And, again, it's just this point of real uncertainty because we don't know really what sort of measures people have been taking over the last few weeks or what's to come in the next couple of weeks."

What does the team take into account when making projections?
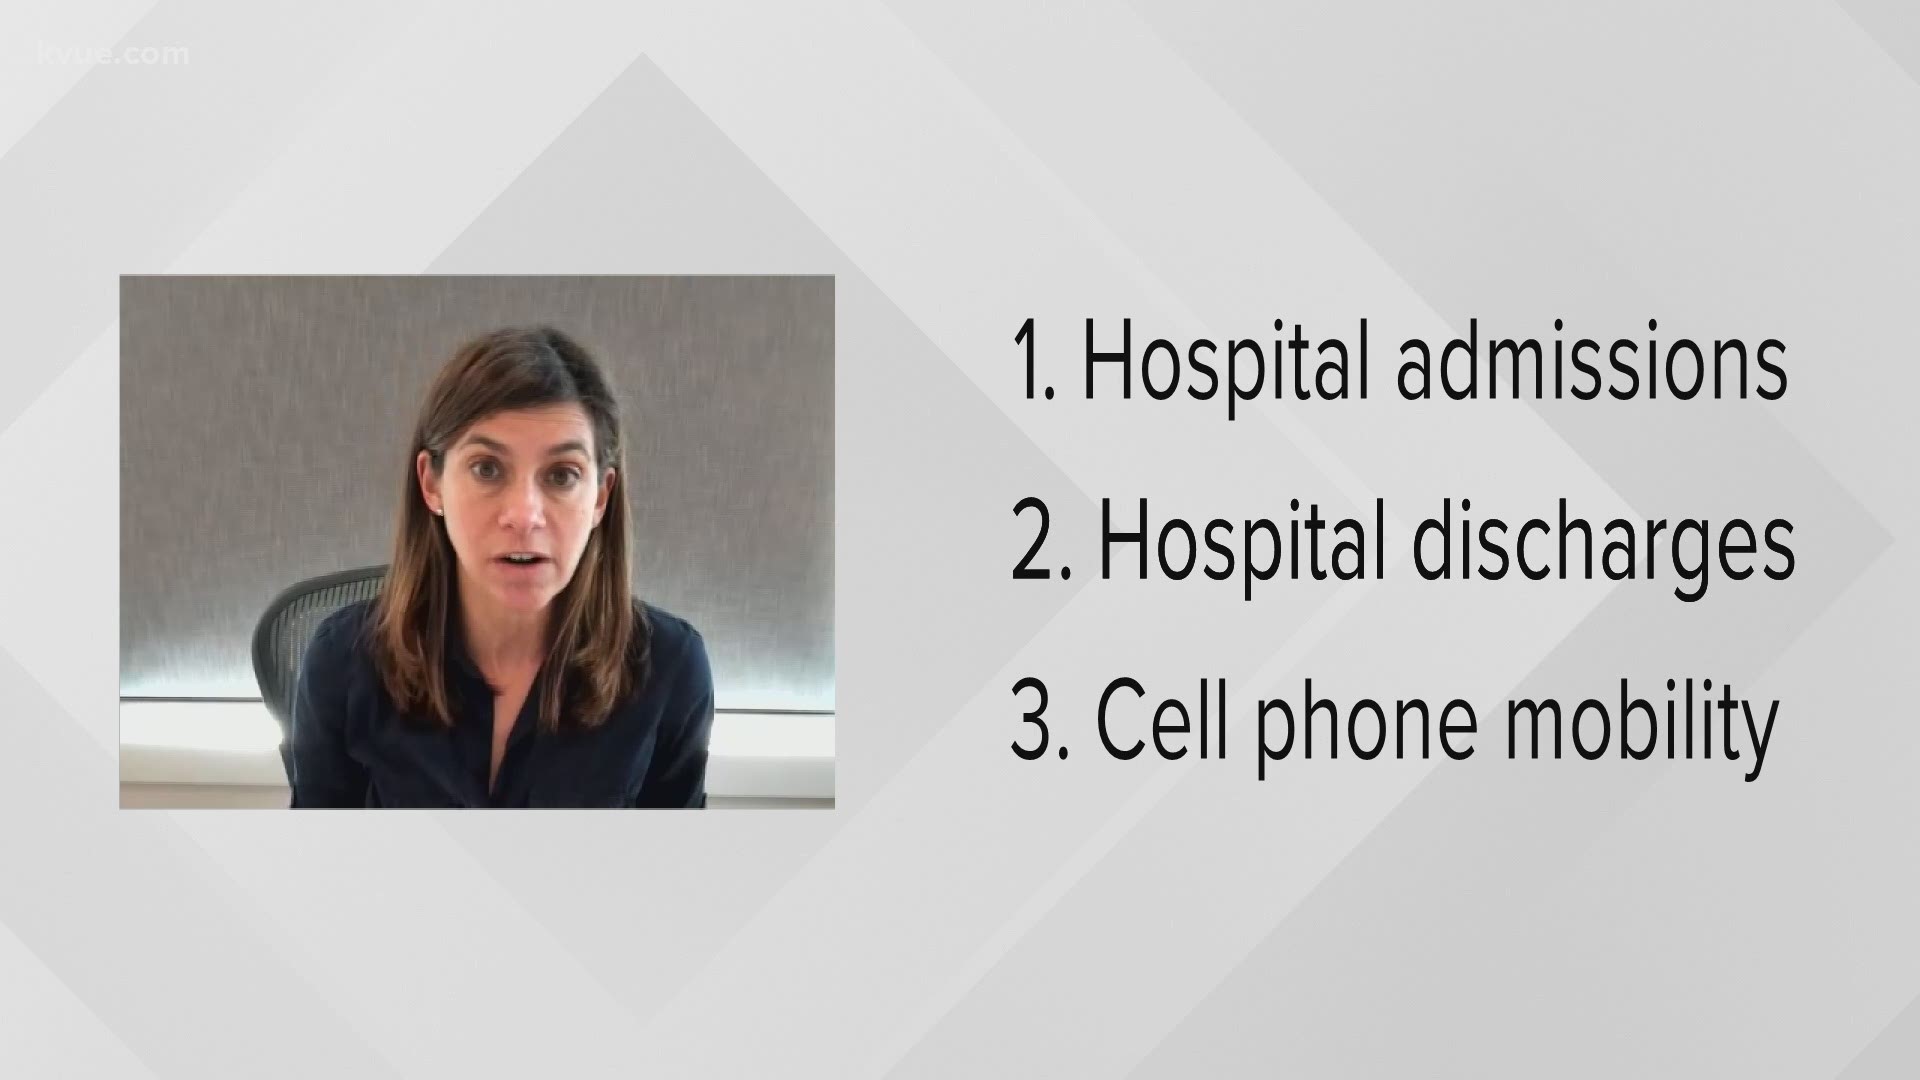
"Basically there are three things that go into the projections on our Austin dashboard. One is how many people have been admitted to the hospital for COVID over the entire time. Of course, we're making the projections up 'til yesterday. How many people have been discharged from hospitals on a daily basis? So those are the two numbers that are directly about COVID. And then the other information that goes into our models is mobility. So we use cell phone mobility data, things like what proportion of the day are people spending at home versus out in public? How many times are people going to restaurants on a given day or given week? How many visits are there to bars and grocery stores and schools? And so we take all of that data, and we use that to estimate how much people are out and about in a way that could lead to the transmission of the virus. But what we can't see in that in that data is whether or not when people go out they're actually wearing face masks responsibly and they're keeping their distance."
More on cell phone mobility data
"This is a really useful source of information on how much people are gathering in public and how much they're staying home and staying safe. And so it turns out it's not perfect. It doesn't tell us exactly how much risk there is of transmission in the community, but it gives us a really detailed look at people's behavior actually in cities all across the country."
PEOPLE ARE ALSO READING: